Decide Smarter.
Start Today
Popular Articles

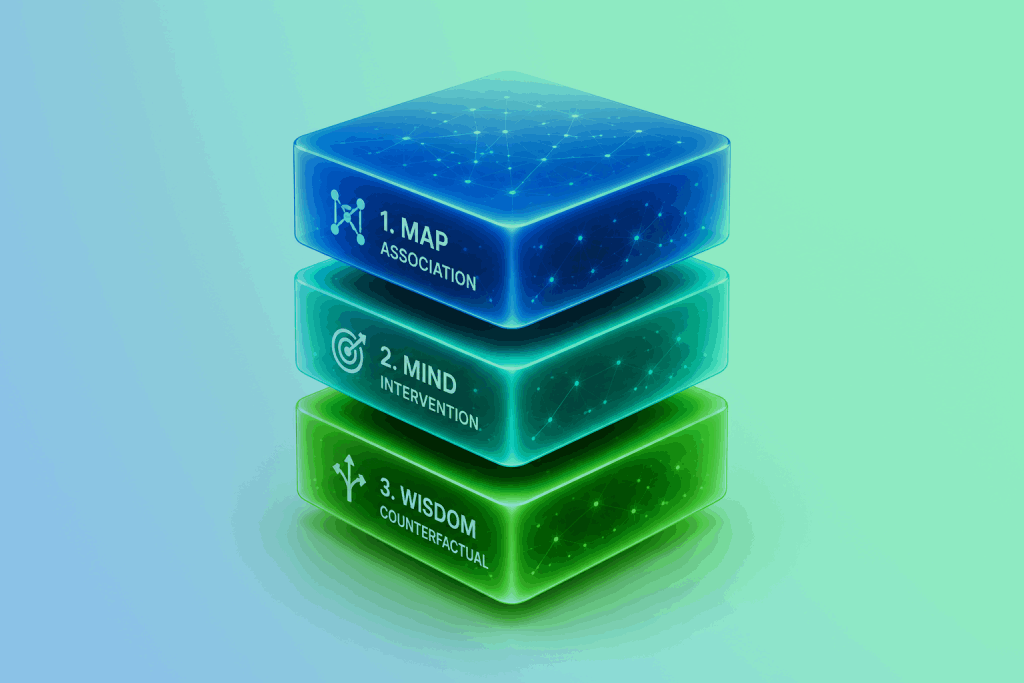

![Decision AI: Modern Decision Intelligence Stack [Part 2 of 2]](https://cdn.prod.website-files.com/69079d5bc1a99349b566161a/69b293b82dc44eb19c6ba0d7_thumbnail%20short%202.png)

.png)
.png)
.png)
.png)
.png)
Power BI, Tableau, Looker. Every enterprise has one. Yet the boardroom question stays the same: "So what should we do?"
What Is Decision Intelligence?
Decision intelligence is an approach to business decision-making that combines data analysis, business context, and causal reasoning to answer "why" questions and recommend actions. Unlike traditional business intelligence that reports what happened, decision intelligence explains why it happened, predicts what might happen next, and suggests what to do about it.
Key characteristics:
- Connects data across multiple sources (not just single databases)
- Understands business context and logic (not just raw numbers)
- Provides causal explanations (not just correlations)
- Recommends specific actions (not just insights)
Dashboards Were Built for Reporting, Not Reasoning
Dashboards show what happened. They don't explain why it happened or what to do next.
They aggregate KPIs into charts: revenue, churn, conversion. But they stop at the surface. Decision-making needs context, causality, and a way to connect the dots. Colorful bars don't do that.
Executives don't fail because they lack data. They fail because they can't connect data across silos.
Power BI might show declining leads, but it won't tell you whether that's a pricing issue, messaging fatigue, or a shift in buyer intent.
The "Single Source of Truth" Is a Mirage
Power BI assumes your truth fits in one dataset.
In reality, truth is fragmented across CRM, ERP, spreadsheets, marketing automation tools, and weekly slide decks.
By the time analysts clean, merge, and refresh those datasets, decisions are already delayed, or worse, based on stale numbers.
Real decision intelligence systems must understand relationships across multiple files: Excel, CSVs, PowerPoint, and text notes. Not just metrics from a single SQL table.
Dashboards Don't Think in Business Logic
Dashboards are static reflections of formulas.
They don't know your business logic: how a "qualified lead" differs from an "opportunity" in your sales model, or that your north zone performance depends on distributor credit limits.
Each chart is a frozen assumption. When the market shifts, your logic breaks, and no dashboard can reason through that change.
To make real decisions, you need systems that learn your business: the categories, hierarchies, and relationships that define how you operate.
Why Data Visualization Doesn't Equal Understanding
A chart may look clear, but it can be dangerously misleading.
Human eyes are drawn to patterns that don't always imply causation. Data visualization tools amplify this illusion, making us feel confident without being correct.
Leaders end up chasing trends that look meaningful but aren't statistically sound.
What they need is an explanation, not just a visualization, of how variables influence each other and where action creates impact.
The Hidden Cost of Business Intelligence Tools: Lost Speed and Cognitive Load
Every dashboard spawns more dashboards.
Teams waste hours comparing filters, reconciling "version 8 final 2.xlsx," debating whether data is refreshed, and exporting charts into PowerPoint decks.
By the time insight reaches decision-makers, the question has already changed.
The result? Slow thinking in a world that demands fast adaptation.
Why AI-Powered Dashboards Still Miss the Mark
Adding generative text summaries to dashboards doesn't solve the core problem.
They describe visuals but don't reason. "Sales dropped by 12%" is not an answer; it's a headline.
Real reasoning connects that drop to campaign ROI, region mix, and supply delays, then recommends corrective actions.
LLMs are language-first. Power BI is number-first. Neither truly understands both.
The solution isn't adding AI summaries to existing business intelligence software. It's adopting AI analyst platforms that reason through data rather than just visualizing it.
Power BI and Tableau Alternatives: What Comes After Dashboards?
Organizations moving beyond traditional business intelligence tools typically explore three paths:
Traditional BI and Data Visualization Tools
Power BI, Tableau, Looker, Qlik
- Best for: Visualizing data from pre-modeled warehouses
- Limitation: Show what happened, not why
- When to use: Reporting known metrics to stakeholders
Self-Service Analytics Platforms
ThoughtSpot, Sigma Computing, Omni
- Best for: Business users who need fast answers without IT
- Limitation: Still require clean, structured data
- When to use: Governed metrics with predictable questions
AI Analytics Platforms and AI Analysts
Modern decision intelligence platforms
- Best for: Understanding "why" and getting recommendations
- Advantage: Work with messy data, learn context, explain causality
- When to use: Decisions require connecting scattered sources
The shift isn't about abandoning visualization. It's about adding reasoning to the analytics stack.
How AI Analysts Work: Key Capabilities
Modern AI analyst platforms share several distinguishing characteristics that set them apart from traditional business intelligence software:
Understanding Business Context, Not Just Data Columns
Advanced platforms build self-learning maps of your data, understanding what "churn," "SKU," or "pipeline stage" means in your specific business context.
Here's how that works in practice:
In your CRM, the field SQL is labeled "Sales Qualified Lead." In your finance ledger, SQL appears in notes as "Service Quality Level."
AI analysts ingest both sources, detect the same token used with different meanings, and build two mapped concepts: CRM.SQL → SalesQualifiedLead and Finance.SQL → ServiceQualityLevel.
When you ask "Why did SQL volume drop," the system resolves which concept you mean by context. For sales questions, it uses the CRM definition, joins pipeline stages, campaign spend, and recent sales rep routing changes, and returns a causal chain. For finance questions, it uses the ledger meaning and links operational incidents that affect service levels.
The system also surfaces the ambiguity so analysts can confirm or correct the mapping.
This demonstrates three capabilities: entity disambiguation across sources, automatic mapping into domain concepts, and human-in-the-loop correction that updates the system for future queries.
Combining Structured and Unstructured Data Analysis
AI analysts reason across structured tables and unstructured text: sales data, campaign notes, board decks, all together.
Providing Causal Analysis and Actionable Recommendations
Ask "Why did North zone sales dip?" The platform runs correlations, surfaces causal drivers, and recommends actions like adjusting distributor credit or changing pricing strategy.
Learning from Your Business Operations
Every query sharpens understanding. Over time, AI analysts become institutional memory, learning from past decisions and their outcomes.
Enterprise-Grade Security and Data Governance
Modern platforms run inside your cloud or private VPC with audit logs and role-based access. No file uploads to public models.
The Future of Business Analytics: From Reporting to Reasoning
Traditional BI tools visualize data. AI analysts understand it.
Dashboards answered "what." AI analysts answer "why" and "what next."
As organizations race toward AI-driven decisions, the winners won't be those with the most dashboards, but those with the most context-aware reasoning systems.
.png)

Shaoli Paul, Product Marketing Manager, DecisionX
Shaoli Paul is a content and product marketing specialist with 4.5+ years of experience in B2B AI SaaS and fintech, working at the intersection of SEO, product messaging, and demand generation. She currently serves as Product Marketing Manager at DecisionX, leading the content and SEO strategy for its decision intelligence platform. Previously, she built global content strategies at Simetrik, Chargebee, and HighRadius, driving strong growth in organic visibility and lead conversion. Shaoli’s work focuses on making complex technology understandable, actionable, and human.